View SQL Monitoring Information
DBCC provides monitoring information for in-progress and history SQL statements in the database. On the Query Monitor and Query History pages, you can see the execution status and details of each SQL statement, and the status of each database session.
Note
DBCC currently doesn’t support displaying information of the Prepare statements.
Access the page
To access the Query Monitor page, you need to:
Access the DBCC dashboard in your browser via
http://<cluster_node_IP>:8080/.Click Query Monitor in the left navigation menu to enter the page.
View SQL execution status
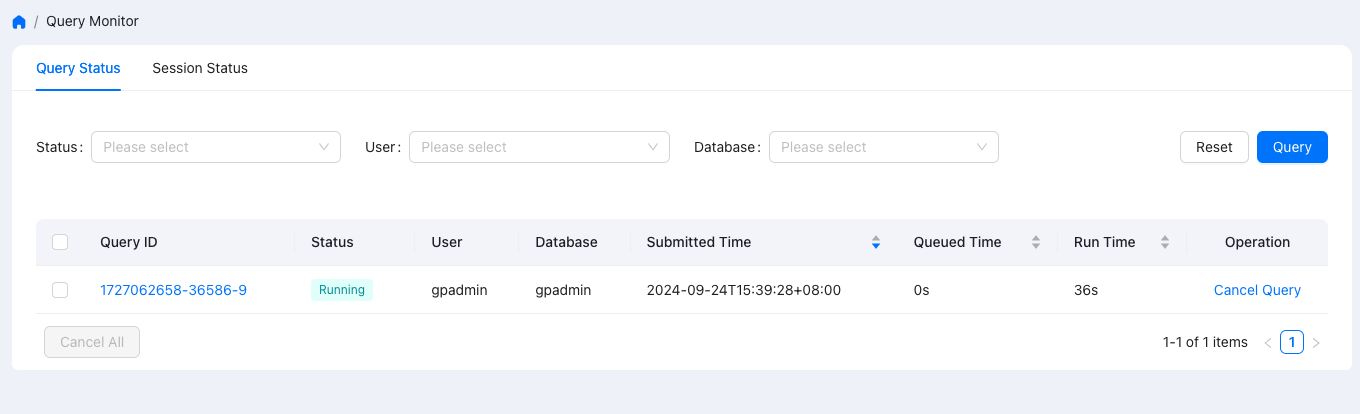
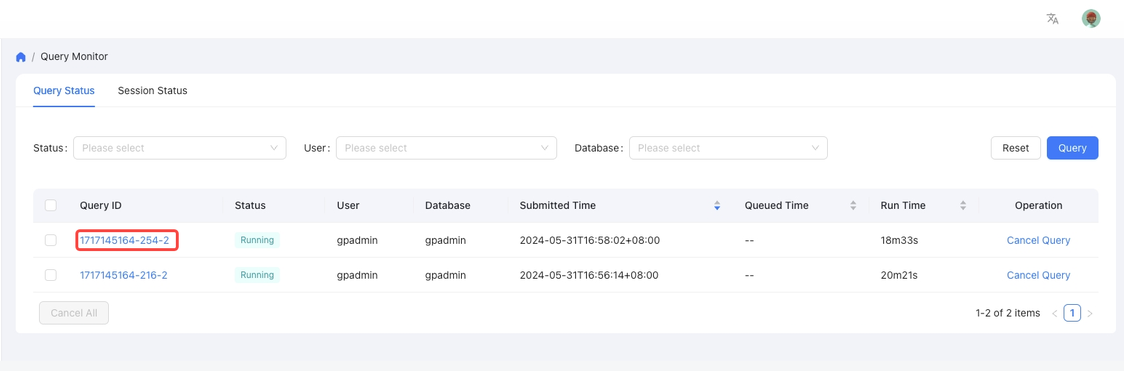
To view the execution status of a SQL statement that is being executed, click the Query Status tab. You can view the information of history queries on Query History.
View in-progress SQL
To check the execution status of an ongoing SQL statement, click on the Query Execution Status section.
Note
You can pause or resume monitoring of in-progress query status by using the following commands:
psql gpperfmon -- Connect to the "gpperfmon" data warehouse.
select query_state_pause(); -- Pause monitoring of ongoing queries.
select query_state_resume(); -- Resume monitoring of ongoing queries.
In the search area, you can filter by the execution status of the SQL statement, user, and database. Click Query to search. The User filter supports multiple selections.
The options in the Status dropdown are described as follows:
Option Name |
Description |
Running |
SQL statement is executing. |
Cancelling |
SQL statement is being cancelled. |
Unknown |
SQL statement execution status is unknown. |
After clicking Query, a list of SQL statements will be displayed in the area below.
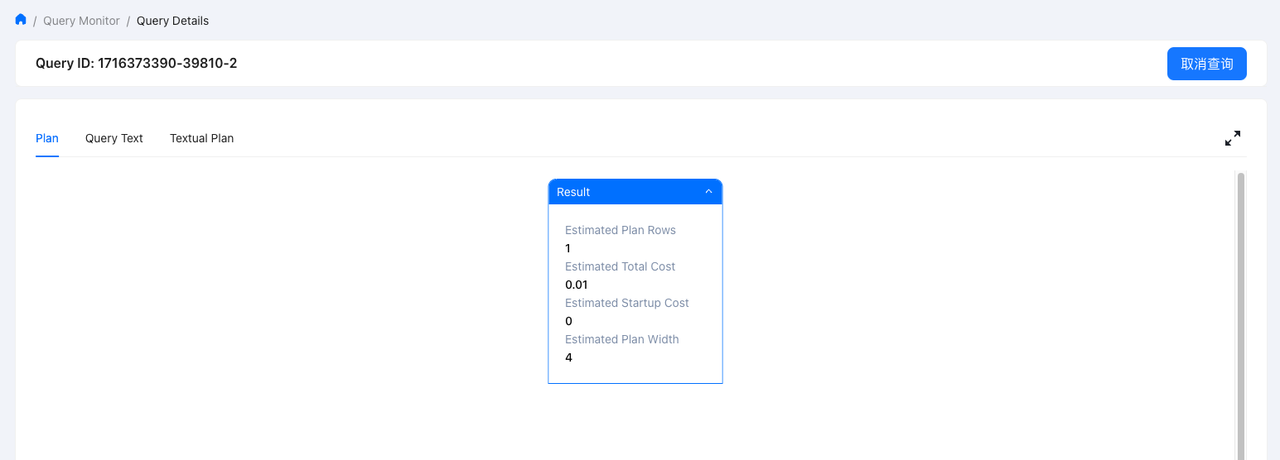
View SQL Details
To view the details of a specific SQL statement, click on the query ID of that SQL statement to enter the details page.
The details page displays information about the SQL execution, and you can click on different tabs to view the query plan diagram, SQL text, and query plan text. In the query plan diagram section, ongoing queries are dynamic, and the animation effect disappears once the query ends.
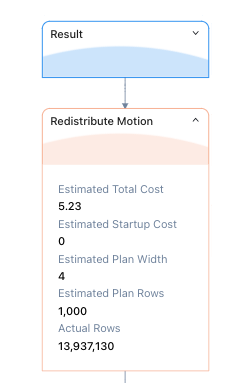
You can click on a module to view specific information, which updates automatically as the query progresses.
Example:
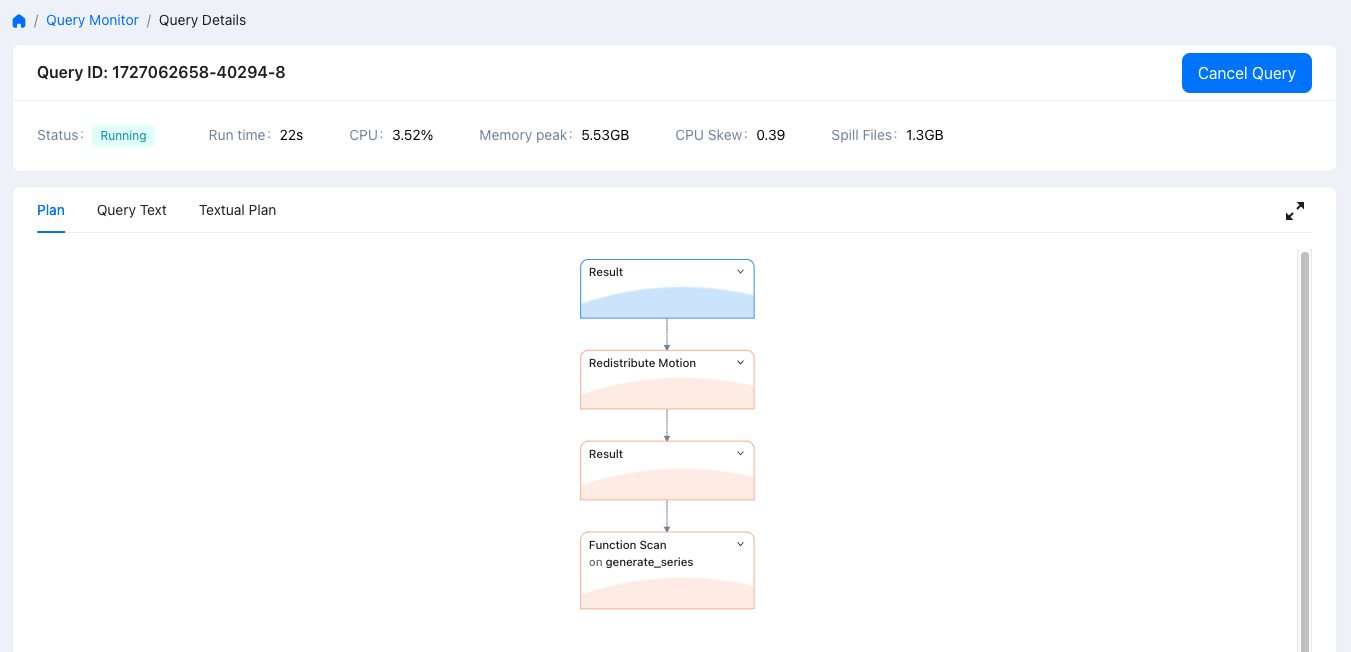
In the Query Plan Text section, you can view the query plan information in text format.
Note
In the Query History page, you can see SQL queries that took longer than a specific duration to execute. By default, the system records queries that take longer than 20 seconds. You can modify this value by changing the min_query_time parameter in the gpperfmon.conf configuration file on the Coordinator node. You can print the directory of this configuration file using echo $COORDINATOR_DATA_DIRECTORY.
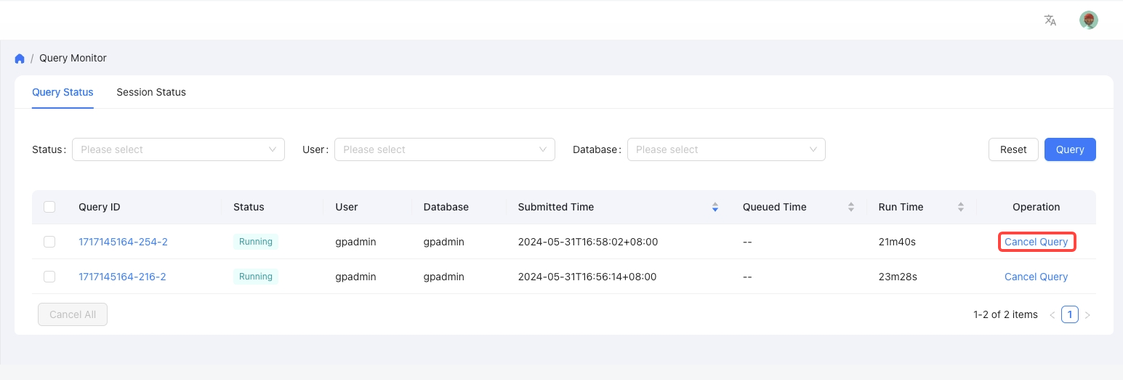
Cancel SQL execution
To cancel one or more SQL statements, locate the Operation column of the corresponding SQL statement in the SQL list, and then click Cancel Query.
View SQL details
To view the details of a SQL statement, click the query ID of the SQL statement, and then enter the details page.
The details page displays the details of SQL execution. You can click different tabs to view the query plan diagram, SQL text, and the query plan text of the SQL statement. An example is as follows:
View session status
To view session status in the database, click the Session Status tab on the Query Monitor page.
A list of real-time sessions running in the database is displayed, including session ID, execution status, the user who operates, the database where the session is running, the start time, the application, and idle time.
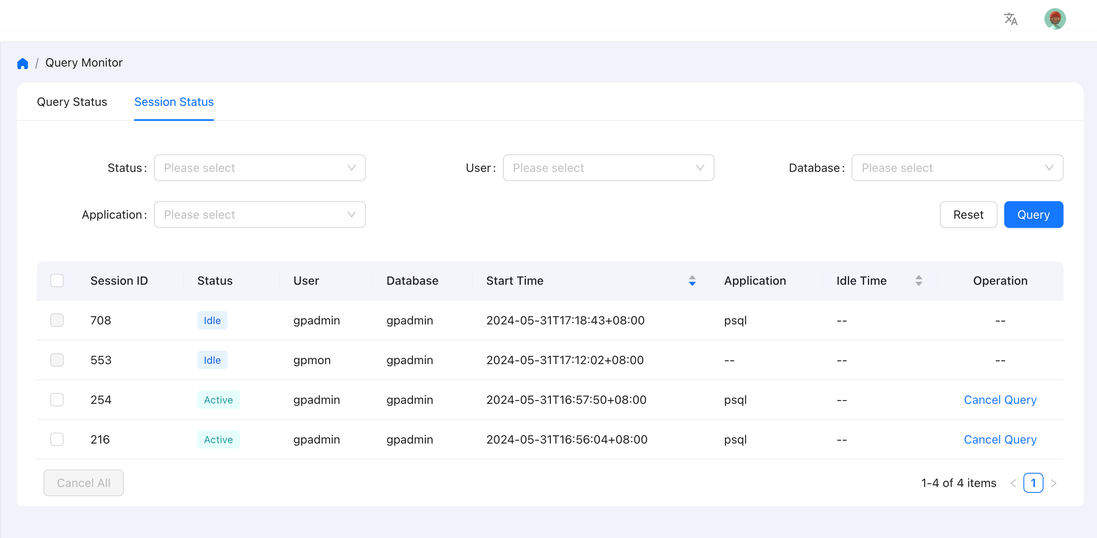
To view the details of a session, in the search area, fill in the corresponding drop-down option box according to the execution status, user, database, and application name. Then click Query to search. The User box supports multiple selections.
The options in the Status drop-down box are described as follows:
Option name |
Description |
|---|---|
Active |
The backend is running the session. |
Idle |
The backend is waiting for new client commands. |
Idle in transaction (aborted) |
The backend is in a transaction, but currently, no query is running. |
Fastpath function call |
The backend is executing the fast path function. |
Disabled |
The status is reported when |
Unknown |
The session status is unknown. |
After clicking Query, a list of sessions is displayed in the area below, and you should be able to find the target session from the list.
By default, the session list is sorted by Start Time in descending order. You can click Start Time to sort in ascending order, or sort by Idle Time. The description of the fields in the list is as follows:
Option name |
Description |
|---|---|
Session ID |
Identifies the unique ID of the session being executed in the database. |
Status |
The status of the session. |
User |
The user who performs the session operation. |
Database |
The database where the session is running. |
Start Time |
The start time of the session. |
Application |
The client application for executing the session. |
Idle time |
The idle time of the session. |
Operation |
For running sessions, you can click Cancel Query to cancel the session. |