Cluster Status and Metrics
You can view the near-real-time status and metric data of the cluster on the Cluster Metrics and Cluster Status pages.
Note
DBCC supports monitoring multiple database clusters. You can switch between clusters using the dropdown menu in the top-right corner of the console.
Access the pages
To access the Cluster Metrics and Cluster Status pages, you need to:
Access the DBCC dashboard in your browser via
http://<cluster_node_IP>:8080/.Click Cluster Metrics or Cluster Status in the left navigation menu to enter the page.
View the overall status and data of the cluster
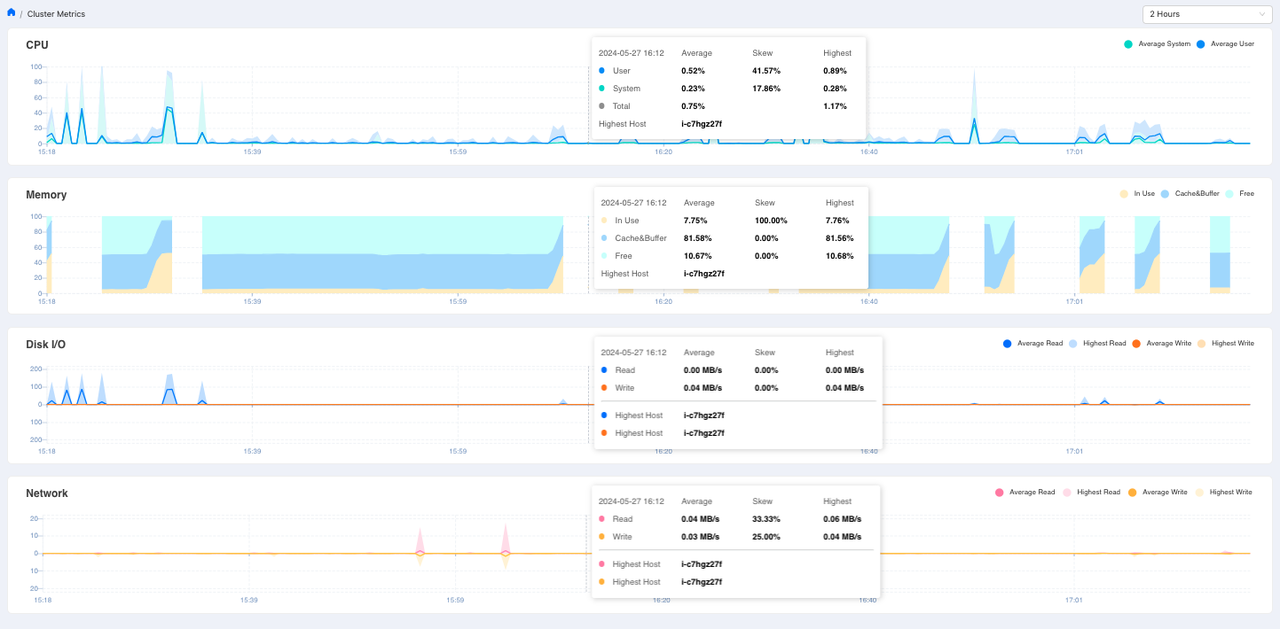
The Cluster Metrics page displays the cluster’s CPU, memory, disk I/O, and network data.
You can adjust the time range of the data displayed through the drop-down menu on the upper-right corner of the page. Available time range options are “2 hours”, “6 hours”, “1 day” and “7 days”. Data calculation time units vary with the selected time range.
The charts have time as the X axis and numerical value or percentage as the Y axis. When you hover over a certain time point, the data of that time will pop up. You can view data from different time points by moving the cursor horizontally. Corresponding legends are provided in the upper right corner of each chart.
Cluster CPU usage status
The chart displays the following metrics:
Average, skewness, and maximum value of the total CPU usage (%) of all user processes.
Average, skewness, and maximum value of the total CPU usage (%) of all system processes.
Average, skewness, and maximum of the total CPU usage (%).
Name of the busiest host.
Cluster memory usage status
The chart displays the following metrics:
Average, skewness, and maximum of the total memory in use (%).
Average, skewness, and maximum of the total buffer and cache memory (%).
Average, skewness, and maximum value of the total available memory (%).
Name of the busiest host
Cluster disk I/O rate
The chart displays the following indicators:
Average, skewness, and maximum value of the total disk read rate (MB/s).
Average, skewness, and maximum value of the total disk write rate (MB/s).
Name of the busiest host by disk read.
Name of the busiest host by disk write.
Attention
The part above the X axis of the chart displays disk read data, and the part below the X axis displays disk write data.
Network I/O rate
Average, skewness, and maximum value of the total network read rate (MB/s).
Average, skewness, and maximum value of the total network write rate (MB/s).
Name of the busiest host by network read.
Name of the busiest host by network write.
Note
The part above the X axis of the chart displays network read data, and the part below the X axis displays network write data.
View the status and data of nodes and hosts
The Cluster Status page displays the status and data of the hosts and nodes in the cluster. You can switch between host and segment tabs from the upper-left corner of the page.
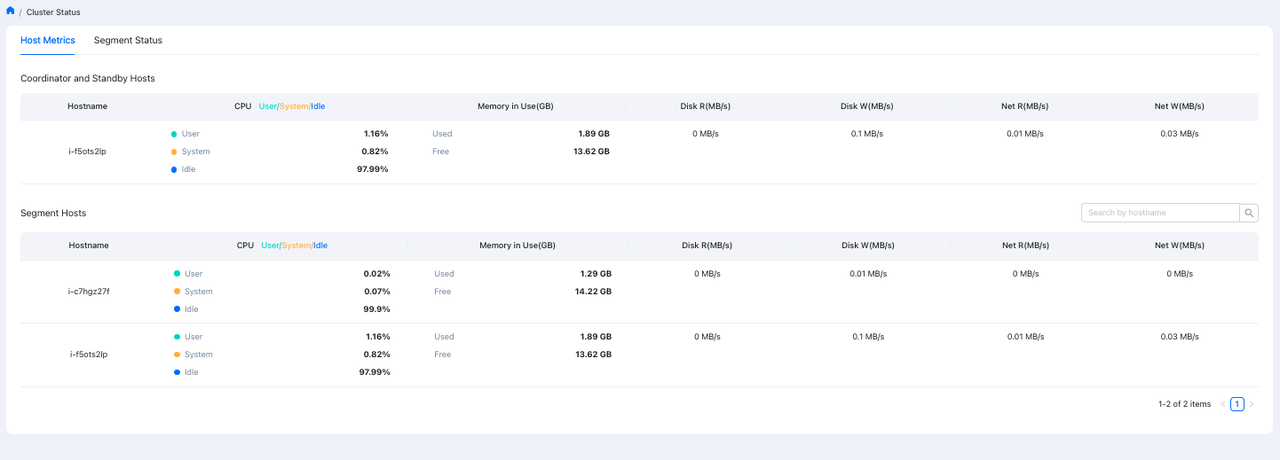
Host metrics
The Host Metrics tab displays data of the coordinator host, its backup host, and the segment hosts:
Note
Users can search for a specific segment host by hostname.
Field |
Description |
|---|---|
Hostname |
The name of the coordinator or segment host |
CPU User/System/Idle |
% of the user processes CPU usage, system processes CPU usage, and idle CPU |
Memory in Use (GB) |
In-use and available memory |
Disk R (MB/s) |
Disk read rate |
Disk W (MB/s) |
Disk write rate |
Net R (MB/s) |
Network read rate |
Net W (MB/s) |
Network write rate |
Segment status
The Segment Status tab displays the status and data of each segment.
The top of the tab shows the overall status of the database, segment count, segment-specific host count, and a segment status indicator.
The table displays the following metrics and status:
Field |
Description |
|---|---|
Hostname |
The name of the segment host |
Address |
The address of the segment on the segment host |
Port |
The listening TCP port of the segment host |
DB ID |
Database ID |
Content ID |
The content identifier of the segment |
Status |
Segment status. Values: Up or Down |
Role |
The current role of the segment. Values: p (Primary) or m (Mirror) |
Preferred Role |
The role that is set for the segment when it is initialized. Values: p (Primary) or m (Mirror) |
Replication Mode |
The synchronization status of the segment with its mirror copy. Values: s (Synchronized) or n (Not In Sync) |